Question about convergence statistics in (i)DMRG

How do I use this algorithm? What does that parameter do?
Post Reply
Qottmann
Posts: 18
Joined: 27 Mar 2019, 09:11
Location: Barcelona

Question about convergence statistics in (i)DMRG

Post by Qottmann »

Hello,

I am a little confused by what the DMRGEngine outputs in the info instance returned from DMRGEngine.run() (like in the dmrg.py example code). I.e. I want to understand what is measured in the bond_statistics and sweep_statistics. I have an example for an iDMRG simulation. On the left I look at the bond_statistics where it appears to be nicely converging, i.e. the energy is monotonically decreasing. On the right, in the sweep statistics, it is neither monotonic nor decreasing. So what is the difference?
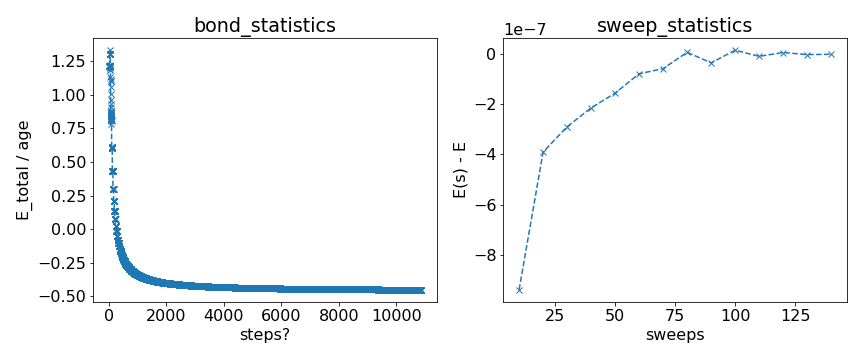
Image

Code: Select all

fig, axs = plt.subplots(ncols=2,figsize=(12,5))
info = np.load("test_info.npy",allow_pickle=True).item()
ax = axs[0]
ax.plot(info["bond_statistics"]["E_total"]/np.array(info["bond_statistics"]["age"]),"x--")
ax.plot()
ax.set_ylabel("E_total / age")
ax.set_xlabel("steps?")
ax.set_title("bond_statistics")

ax = axs[1]
ax.plot(info["sweep_statistics"]["sweep"],info["sweep_statistics"]["E"] - info["E"],"x--")
ax.set_ylabel("E(s) - E")
ax.set_xlabel("sweeps")
ax.set_title("sweep_statistics")


plt.tight_layout()
plt.savefig("test_info_statistics.png")
You can generate the picture with the test_info.npy

I am aware of the description of update_stats and guess this is the same as bond_statistics - but I still dont get what the different energies that are measured are (because clearly they must be different?).

My gut feeling is the sweep statistics is the better way to look at it. If that is true, how can it be that the energy per site is increasing and not decreasing in the optimization? The phase is critical (gapless in the bose hubbard model).

Best regards,
Korbinian
User avatar
Johannes
Site Admin
Posts: 413
Joined: 21 Jul 2018, 12:52
Location: TU Munich

Re: Question about convergence statistics in (i)DMRG

Post by Johannes »

is not the energy you want to study for convergence' it is the total energy of the system that contains age sites, including all energy terms in the environments with whatever state you had at that point.

Pictorially, the "total" system that infinite DMRG grew after a couple of sweeps looks like (assuming a 2-site unit cell for simplicity)

Code: Select all

  A[-age/2+1] A[-age/1+2] ... A[-1] A[0] S B[1] B[2] ... B[age/2-1] B[age/2]
=(def. of envs.)=               LP  A[0] S B[1] RP 
where B[age/2] and A[-age/2+1] are the tensors you had in the very beginning for the initial state, A[-age/1+2] and B[age/2-1] the ones after the first growth of the environment and so on. They are just contracted into LP and not accessible anymore - it's just the history how your MPS was updated.
The only states that you do keep are the A[0] and B[1]; they are your current best guess for the converged infinite MPS.

The E_total is the energy of that total system with a total of age sites.
It hence still has the history of what you did while growing the system, which you don't really care about - really, you care about what the current energy density in the center is, for MPS constructed by the unit cell A[0] S B[1].
This energy is given by the *difference* (E_total[s] - E_total[s-1])/ (age[s] - age[s-1]) where s is the number of sweeps performed, because this difference subtracts off the energy contributions already in the environment.

In other words, the E_total has an "error" proportional to 1/(#sweeps performed) of contributions outside of the current unit cell estimate - hence the very slow convergence in your left plot. If you look into the source of DMRG.plot_update_stats, you'll find that you can also use yaxis='E' to get the correct energy estimate with subtraction.
User avatar
Johannes
Site Admin
Posts: 413
Joined: 21 Jul 2018, 12:52
Location: TU Munich

Re: Question about convergence statistics in (i)DMRG

Post by Johannes »

To be clear, the actual convergence of DMRG is much faster than just 1/(#sweeps performed), as you see on the right - there's a log-scale on the yaxis :)
Post Reply